Stop Guessing, Start Knowing: Making Data-Driven Decisions with Zoho Analytics
📑 Table of Contents
Introduction
Every day, your business generates a massive amount of data. Sales figures from your CRM, support tickets from your helpdesk, financial transactions from your accounting software. But is this data actually working for you? For most businesses, it's trapped in different applications, making it impossible to see the big picture.
Zoho Analytics is the bridge between your data and your decisions. It’s a powerful Business Intelligence (BI) and data analytics platform that helps you uncover hidden insights and understand your business like never before.
What is Zoho Analytics?
Zoho Analytics is a self-service BI platform that allows you to analyze data from a wide variety of sources and create insightful reports and dashboards. It empowers you to ask complex questions about your business and get clear, visual answers in minutes, without needing to be a data scientist.
Key Features That Empower Your Business
1. Connect to Any Data Source
Zoho Analytics can pull data from virtually anywhere. It has seamless, pre-built connectors for other Zoho Apps (CRM, Books, Desk, etc.), as well as for third-party services like Google Ads, Salesforce, and social media platforms. You can also upload data from spreadsheets or connect to cloud and on-premise databases.
2. AI-Powered Assistance with Zia
Don't know where to start? Just ask Zia, Zoho's AI assistant. You can literally type a question like, "Show me sales by region for the last quarter," and Zia will automatically generate the most relevant report or chart. Zia can also analyze your data and provide automated insights and narratives.
3. Drag-and-Drop Report Builder
You don't need to write complex code to build powerful reports. The intuitive drag-and-drop interface lets you easily create pivot tables, charts, and tabular reports. Slice and dice your data, drill down into specifics, and visualize trends with just a few clicks.
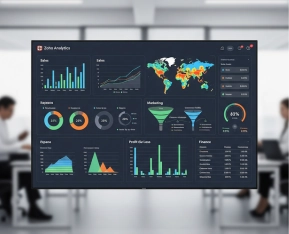
4. Interactive, Sharable Dashboards
Combine multiple reports into a single, beautiful dashboard that gives you a high-level overview of your business performance. These dashboards are interactive, allowing you to filter by date, region, or any other variable. You can securely share them with your team, embed them on internal websites, and schedule them to be emailed automatically.
5. Cross-Functional Analytics
This is the ultimate benefit. By blending data from different departments, you can answer critical business questions. For example, you can combine marketing spend data from Google Ads with sales data from Zoho CRM to calculate your true marketing ROI. Or, you can blend support ticket data from Zoho Desk with customer data from CRM to see if your VIP customers are getting faster support.